I was listening to public radio this morning when I heard that murder was up 11.8%. If my kids misbehaved 11.8% more I’d probably be furious. But that still felt like a small increase compared to what I’ve seen in Los Angeles. So here’s some more data for context. All taken together, it seems to show a city returning to the crisis-level crime of the 1980s and 1990s, but not there yet.
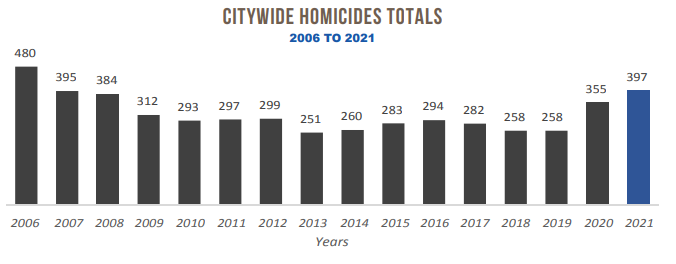
Over the last two years, crime in Los Angeles has exploded. In 2021, there were 397 murders in Los Angeles, up 11.8% from 2020. This may not seem so bad, but crime is up 53.9% from 2019. Los Angeles saw the most homicides since 2007, when there were 395 killings. The Los Angeles County Sheriff’s Department, whose jurisdiction is the County of Los Angeles, reported 201 homicides in 2020, up from 145 in 2019. LASD has not given an official number of homicides for 2021, but Sheriff Alex Villanueva estimated the number at 280. This is a 2-year increase of nearly 100%.
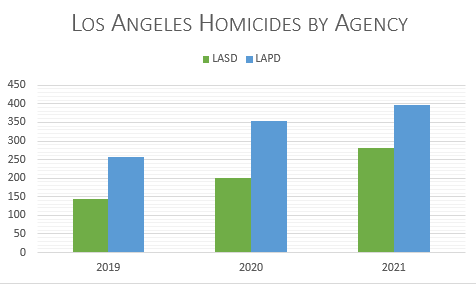
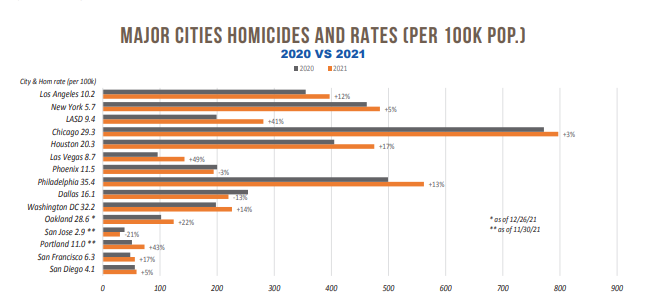
By contrast, there were 797 homicides in Chicago and 485 in New York City. Los Angeles is the 5th most dangerous major city in the report. It compares unfavorably to San Diego, which has less than half the per-capita homicides, and San Jose, which has about a third. Interestingly, LAPD data separates out LASD data in the chart below, but did not do that for any other city. Combining the data would make the LAPD’s crime jump look much larger.
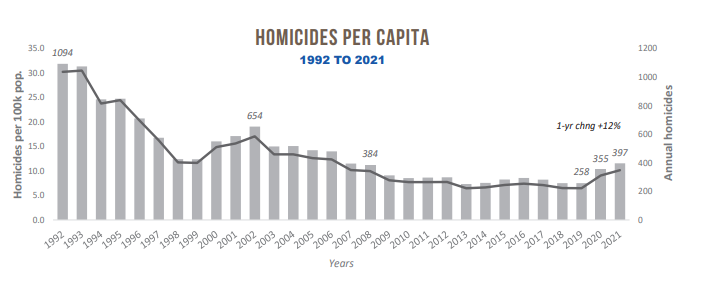
Here’s a look at per capita homicides, which helps contextualize the numbers in light of LA’s growing population.
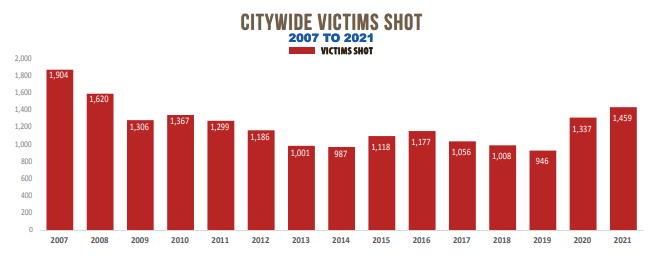
1,459 people were shot in Los Angeles in 2021. That’s up from 946 in 2019. LAPD officers fired their weapons 37 times in 2021, up from 27 in 2020, and 20 in 2019. 18 people were killed in 2021 from officer-involved shootings.
Violent crime in the city increased 3.9% from 2020 to 2021. Property crime rose 4.2% last year over 2020, but was less than 2019.
Notes
Most of the crime data from the City of Los Angeles is taken from LAPD’s 2021 Crime & Initiatives Report. The charts are excellent.
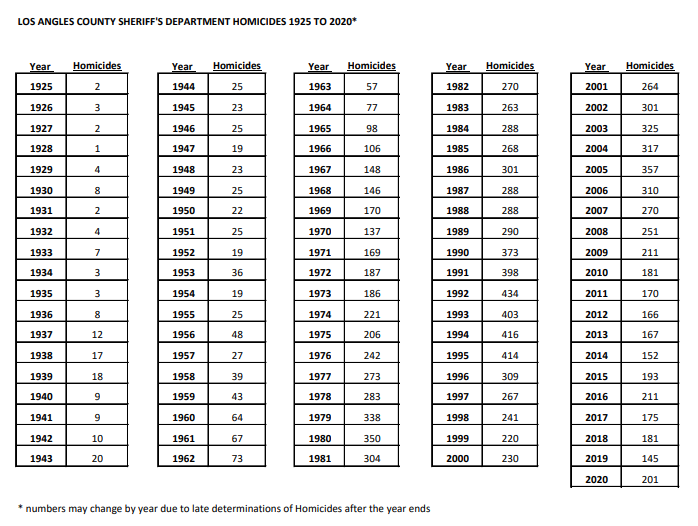
LASD data is here. It does not appear to be as up-to-date as LAPD. For example, here is their historical homicide chart:
Here’s a look at City of Los Angeles homicides going back a bit farther for context: